![]()
MONTHLY AND SEASONAL REPORTS ON THE WEATHER DURING 2005 FROM BRADNINCH (Weather records started in 1990)
( See also charts by month from statistics main page)
Occasionally there might be links from this page to other pages especially if there is any severe or unusual weather like thunderstorms or any charts of interest, ect. All links will be in blue and don't forget to use the back button on your browser to return to this page.
REPORTS BY MONTH= Jan, Feb, Mar, Apr, May, Jun, Jul, Aug, Sep, Oct, Nov, Dec.
REPORTS BY SEASON= Winter, Spring, Summer, Autumn.
JANUARY
The first 2 weeks saw an Atlantic flow with rainfall most days. From the 20th a massive high pressure in the north Atlantic dominated to the end of the month with settled weather.
Rainfall for the month was only 71mm and this was -13.4mm from the 10 year average. It was a very mild January. Temperatures were:- 9.9C (+2.0 From average + highest on record), Min 4C (+1.3C) and a mean of 7.0C (+1.7C).
OVERALL WET START DRY SETTLED END
FEBRUARY
The first 2 weeks were mild and mostly settled here in the south. High pressure was in the Atlantic for most of the month and this kept all the wet weather to the north. Like the last 4 months all rain bearing clouds were in the north with us here in mid-Devon only having sporadic bursts of light rain.
From the 19th it turned much colder with some light snow around. The wind direction was northerly to start with then turning to the north east. Out of the last 7 days of the month we had snowfall on 5 of them with 1cm of lying snow on the 23rd. The minimum dropped to -4C on the 28th.
Rainfall was only 24.8MM this being -34.2MM from the average. Temperatures were:- Max 8.1C (-.6C from average), Min 2.1C (-.7), and the mean was 5.1C (-.6C).
WINTER SUMMARY (Dec 2004- Feb 2005)
Like I said above rainfall amounts at any given day or front have falling dramatically over the past year. December and January were both mild months with February having below average temperatures.
Rainfall for the season was 171.8MM and this was 77.7MM below the average of 259.5MM. Temperatures were:- Max 9.1C (+.8C) , Min 3.1C (0.0C) and the mean was 6.1C (+.4C).
MARCH
Very cold start to the month as a low moved across the south and as this low moved away a cold northerly wind came in. The maximum on the 2nd only reached 4.5C with snow showers. The Atlantic high moved across the country from the 6th and with a cold flow around it we had some very cold nights. A low of minus 5.2C at 05:03 on the 7th made this the coldest night for a year. The high continued to dominate our weather with only 3.4MM of rainfall falling in the 2 week period to the 15th. Only 45.2MM have fallen from the 23rd January to the 20th March. At last from the 15th the high got pushed over to Greenland and Atlantic fronts started to move in. Warm air coming up from the south gave a maximum of 20.3C on the 19th making this the joint warmest March day on record. Low pressure developed over the south and this gave a very wet day on the 29th with a total of 26.4MM falling.
Well level at the end of the month was only 4.05FT making this the lowest March level on record. Click here to view well chart.
Temperature were within 0.5C from the averages with a Max of 11.7C (+.5C), Min 4.3C (-.1) , Mean 8.0C (+.2C).
Rainfall amazingly turned out to be higher than the average with 61.8MM (+6.6MM)
APRIL
Warm southerly winds greeted the month with a maximum of 18.8C on the 2nd. The warm air got pushed out of the way by a cold front that moved from west to east on the 4th. A deep low moved across Scotland on the 6th and as this pulled away on the 7th there was a cold blast from the north. With an Arctic air stream this produced fantastic visibility and some hail showers on the 8th. As the wind dropped off overnight on the 8th this produced the coldest April night for 9 years with a low of minus 2.3C at 06.41 hours on the 9th. The 10th saw this cold spell disappear as a warm front moved east off the Atlantic and temperatures started to climb again. A maximum of 17.1C on the 12th felt very pleasant with light westerly winds. Another low moved down from the north on the 13th and this one again had much colder air on its back edge from the north. The low by now over the south of the country produced some very heavy slow moving hailstorms on the 14th and 15th. Predicting where showers are going to break out is impossible even for the new super computer at the Met Office. You have to remember that a shower cloud can develop out of a clear sky, produce rain, and die off again all in half an hour. However, some showers will last longer as they did on the afternoon of the 15th. Parts of south Devon had thunderstorms with 2 inches of hail on the ground, while we here in Bradninch were completely dry as we stayed in the dry-line. With a cold pool of air overnight on the 16th, we again had a very cold night with a low of minus 1.7C at 03.50 on the 17th. More fronts moved in on the 17th bring wet and windy weather and it remained unsettled until the 23rd. Warmer air moved in behind a warm front that moved north on the 29th.
Temperatures were higher than the average with a Max of 14.4C (+1.1), Min 5.4C (+.1C), and the mean was 9.9C (+.6).
Rainfall was 95.4MM and was +10.8MM.
MAY
Fairly unsettled month with sunshine amounts below average and rainfall above average. A cool month with no long lasting high pressure.
Temperatures were: Max 16.7C (-.9C), Min 7.1C (-1.0C), Mean 11.9C (-1.0C).
SPRING SUMMARY (March-May)
Unsettled Spring with above average rainfall and temperatures around the average.
Average Temperatures: Max 14.2C (0.2C), Min 5.6C (-.4C) and the mean was 9.9C (-.1C)
Rainfall was 222.6MM and this was +27.8MM from the average
JUNE
Week 1 (1st - 5th)= An unsettled spell from the west with fronts crossing the country.
Week 2 (6th - 12th)= High pressure over the country bringing warmer weather but a cold front on the 10th introduced cooler air.
Week 3 (13th - 19th)= Low pressure from the north started the week. Fronts then came off the Atlantic to bring warmer, humid weather. A warm front moved east on the 16th. The week ended hot with 27.4C on the 19th.
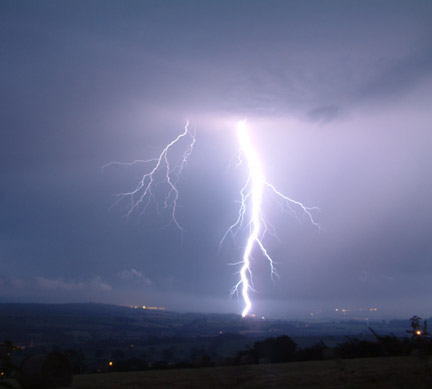
Week 4 (20th - 26th)=A weak cold front moved east then another warm front moved north on the 22nd. The temperature climbed to 28.6C on the 23rd. A thundery low developed over the south to bring a staggering 9 hours of lightning from 2am on the 24th. Click on photo below for link to the report on the storms. After the storms cooler air moved in.
Week 5 ( 27th - 30th)= Another low moved up from the south on the 28th to bring more thundery weather. The end of the month had an Atlantic flow just like the start of the month.
Monthly stats= Rainfall was +13.7mm above the average with 75.8MM falling. Temperatures were: Max 20.9C(+1.0C), Min 11.2C (+0.5C) and the Mean was 16C (+0.7).
A THUNDERY MONTH OVER THE WHOLE COUNTRY
JULY
Start of the month (1st - 3rd)= An unsettled start to the month with a low moving into the western side of the UK.
Week 1 (4th - 10th)= Low pressure dominated the start of the week then a high moved in to bring much settled weather and the temperatures climbed.
Week 2 (11th - 17th)= High pressure dominated this week with some very high temperatures. The minimum on the 12th was 18.6C and the maximum on the 13th was 29.3C.
Week 3 (18th - 24th)=A cold front moved down on the 18th and it became much fresher. Pressure began to rise again until the 22nd. The 23rd saw a low move up from the south west with its associated fronts.
Week 4 ( 25th - 31st)= After a ridge of high pressure to start the week another low developed over the south and moved north. This low stayed around all week and was also one of the triggers for the Birmingham F2 tornado on the 27th.
Monthly stats= Rainfall was +21.5mm above the average with 67.4MM falling. Temperatures were: Max 21.7C (0.0C), Min 13.0C (+0.1C) and the Mean was 17.4C (+0.1).
AUGUST
Week 1 (1st - 7th)= High pressure over the south with all active fronts to the northwest. Only 6.4mm fell in the first week.
Week 2 (7th - 14th)=Pressure remained high and the temperature climbed to 25.4C on the 11th. An occluded front moved south overnight on the 12th to bring fresher air in.
Week 3 (15th - 21st)=High still in control with a warm sector of weather over the country. The temperature rose again to 25.9C on the 17th with glorious unbroken sunshine. The 18th saw a cold front move south to once again bring fresher conditions.
Week 4 (22nd - 28th)=Active fronts moved across the north with the south having the best weather. However an active cold front produced 11.4MM on the 24th. Pressure started to rise again at the end of the week.
Week 5 ( 29th - 31st)=Hot, Humid air moved up from the south with a high but the 31st saw a cold front move into the west and this produced some thunderstorms over the southwest.
Monthly stats= Rainfall was 40mm below the average with 38.4MM falling. Temperatures were: Max 22.3C(+1.0C), Min 10.8C (-2.2C THE LOWEST AUGUST MINIMUM ON RECORD) and the Mean was 16.5C (-0.6C).
SUMMER SUMMARY
Average sort of Summer with no heat wave nor no long wet spells.
Average Temperatures: Max 21.6C (+0.7C), Min 116C (-.6C) and the mean was 16.6C (+.2C)
Rainfall was 181.6MM and this was -4.6MM from the average. Rainfall for this Summer was exactly the same as it was in 2004.
SEPTEMBER
Week 1 (1st - 4th)= High pressure start then a thundery breakdown as the maximum reached 25.1C on the 4th.
Week 2 (5th - 11th)=Low pressure dominated this week with low pressure over the whole country for most of the week. 15.6MM fell on the 10th making this the wettest day of the month.
Week 3 (12th - 18th)=Pressure started to build over the south of the country but this didn't last as a low moved in from the south west. High pressure returned on the 16th and with a northerly it turned colder. The earliest frost since records began came on the 17th with an air temperature of 2.4C.
Week 4 (19th - 25th)=Active fronts affected the northwest while the south had predominantly high pressure until the 22nd. The 23rd saw an active cold front move east. More fronts followed to end the week.
Week 5 ( 26th - 30th)=The month ended with a flow from the Atlantic bringing unsettled weather with a series of fronts crossing the country.
Well level was at a record low for September with only 0.3" of water in the 35ft deep well.
Monthly stats= Rainfall was 36.4mm below the average with 49MM falling. Temperatures were: Max 19.9C(+1.9C), Min 10.4C (-0.4C) and the Mean was 15.2C (+0.8C).
OCTOBER
Best just to summaries the whole month as very unsettled dominated by Atlantis fronts crossing the country. A lot of southerly winds have made it the 3rd warmest October on record. A very wet month with 28.4MM falling on the 19th.
Monthly stats= Rainfall was 139.4mm and this was +45.6MM from the long term average.. Temperatures were: Max 16.2C(+2.3C), Min 10.4C (+2.7C) and the Mean was 13.3C (+2.5C).
NOVEMBER
WEEK 1
A week dominated by Atlantic
depressions and fronts bringing lots of rainfall.
WEEK 2
Again more Atlantic fronts with
rain
WEEK 3
A change to a northerly
flow with high pressure building.
WEEK 4
High pressure to start then a
cold front associated with a depression came down the North Sea and a northerly
blast developed. SNOW affected many parts with the south west having a lot.
8" fell on Bodmin.
END OF THE MONTH
Still a flow from a northerly direction.
AUTUMN
Very mild September with average rainfall. A very wet October with fronts crossing the country. November continued unsettled and wet until mid month when we had a northerly blast.
Average Temperatures: Max 15.6C (+1.5C), Min 7.7C (+.2C) and the mean was 11.6C (+.6C)
Rainfall was 277.6MM and this was -4.7MM from the average.
DECEMBER
START OF THE MONTH 1st - 4th
Very unsettled with low pressure over the country with heavy rain and strong winds.
WEEK 1 5th - 11th
Start of the week had more fronts but pressure built at the end of the week.
WEEK 2 12th - 18th
HIGH PRESSURE IN CONTROL WITH ONLY SOME WEAK FRONTS CROSSING IT.
WEEK 3 19th - 25th
Again high pressure in control with lots of settled conditions.
WEEK 4 26th - 31st
High pressure dominated again with a cold plunge of air and this gave the coldest December night on record with minus 7.7C, this was also the coldest night since February 1991. The end of the month saw a change to milder wetter weather.
Monthly stats= Rainfall was 92.2mm and this was -14.1MM from the long term average.
Temperatures were: Max 8.1C(+0.1C), Min 1.7C (-1.4C), and the Mean was 4.9C (-0.7C).
No severe weather around this year locally. We did have a good thunderstorm in May with a fantastic roll cloud - the best I've ever seen.
The highest Maximum was 29.3C on the 13th/7 and the lowest Maximum was 1.6C on the 28/12
The highest Minimum was 18.6C on the 12/7 and the lowest Minimum was -7.7 on the 29/12
The average yearly temperatures were: Max 15C (+.7C), Min 6.9C (-.3) and the mean was 11.1C (+.3C), All very close to the average.
Wettest day was 28.4MM on the 19/10 and there was 195 days with rainfall. Dry days totaled 170.
Rainfall for the year was 869.8MM and this was 43.6 down on the long term average.
Highest pressure was 1040.6MB on the 9th/12 and 12th/12 and the lowest pressure was 967.5MB on the 2nd/12
There was a total of 40 air frosts and 64 ground frost during the year.
Days with: Thunder 11, Hail 14, Sleet 6, Snow 13, Fog 6.